Simulating Strategies
The Simulate tab in the Strategy Lab lets you test a strategy idea against historical data before committing real capital.
All computation runs in your browser - results appear instantly and you can adjust parameters and re-run as many times as you like.
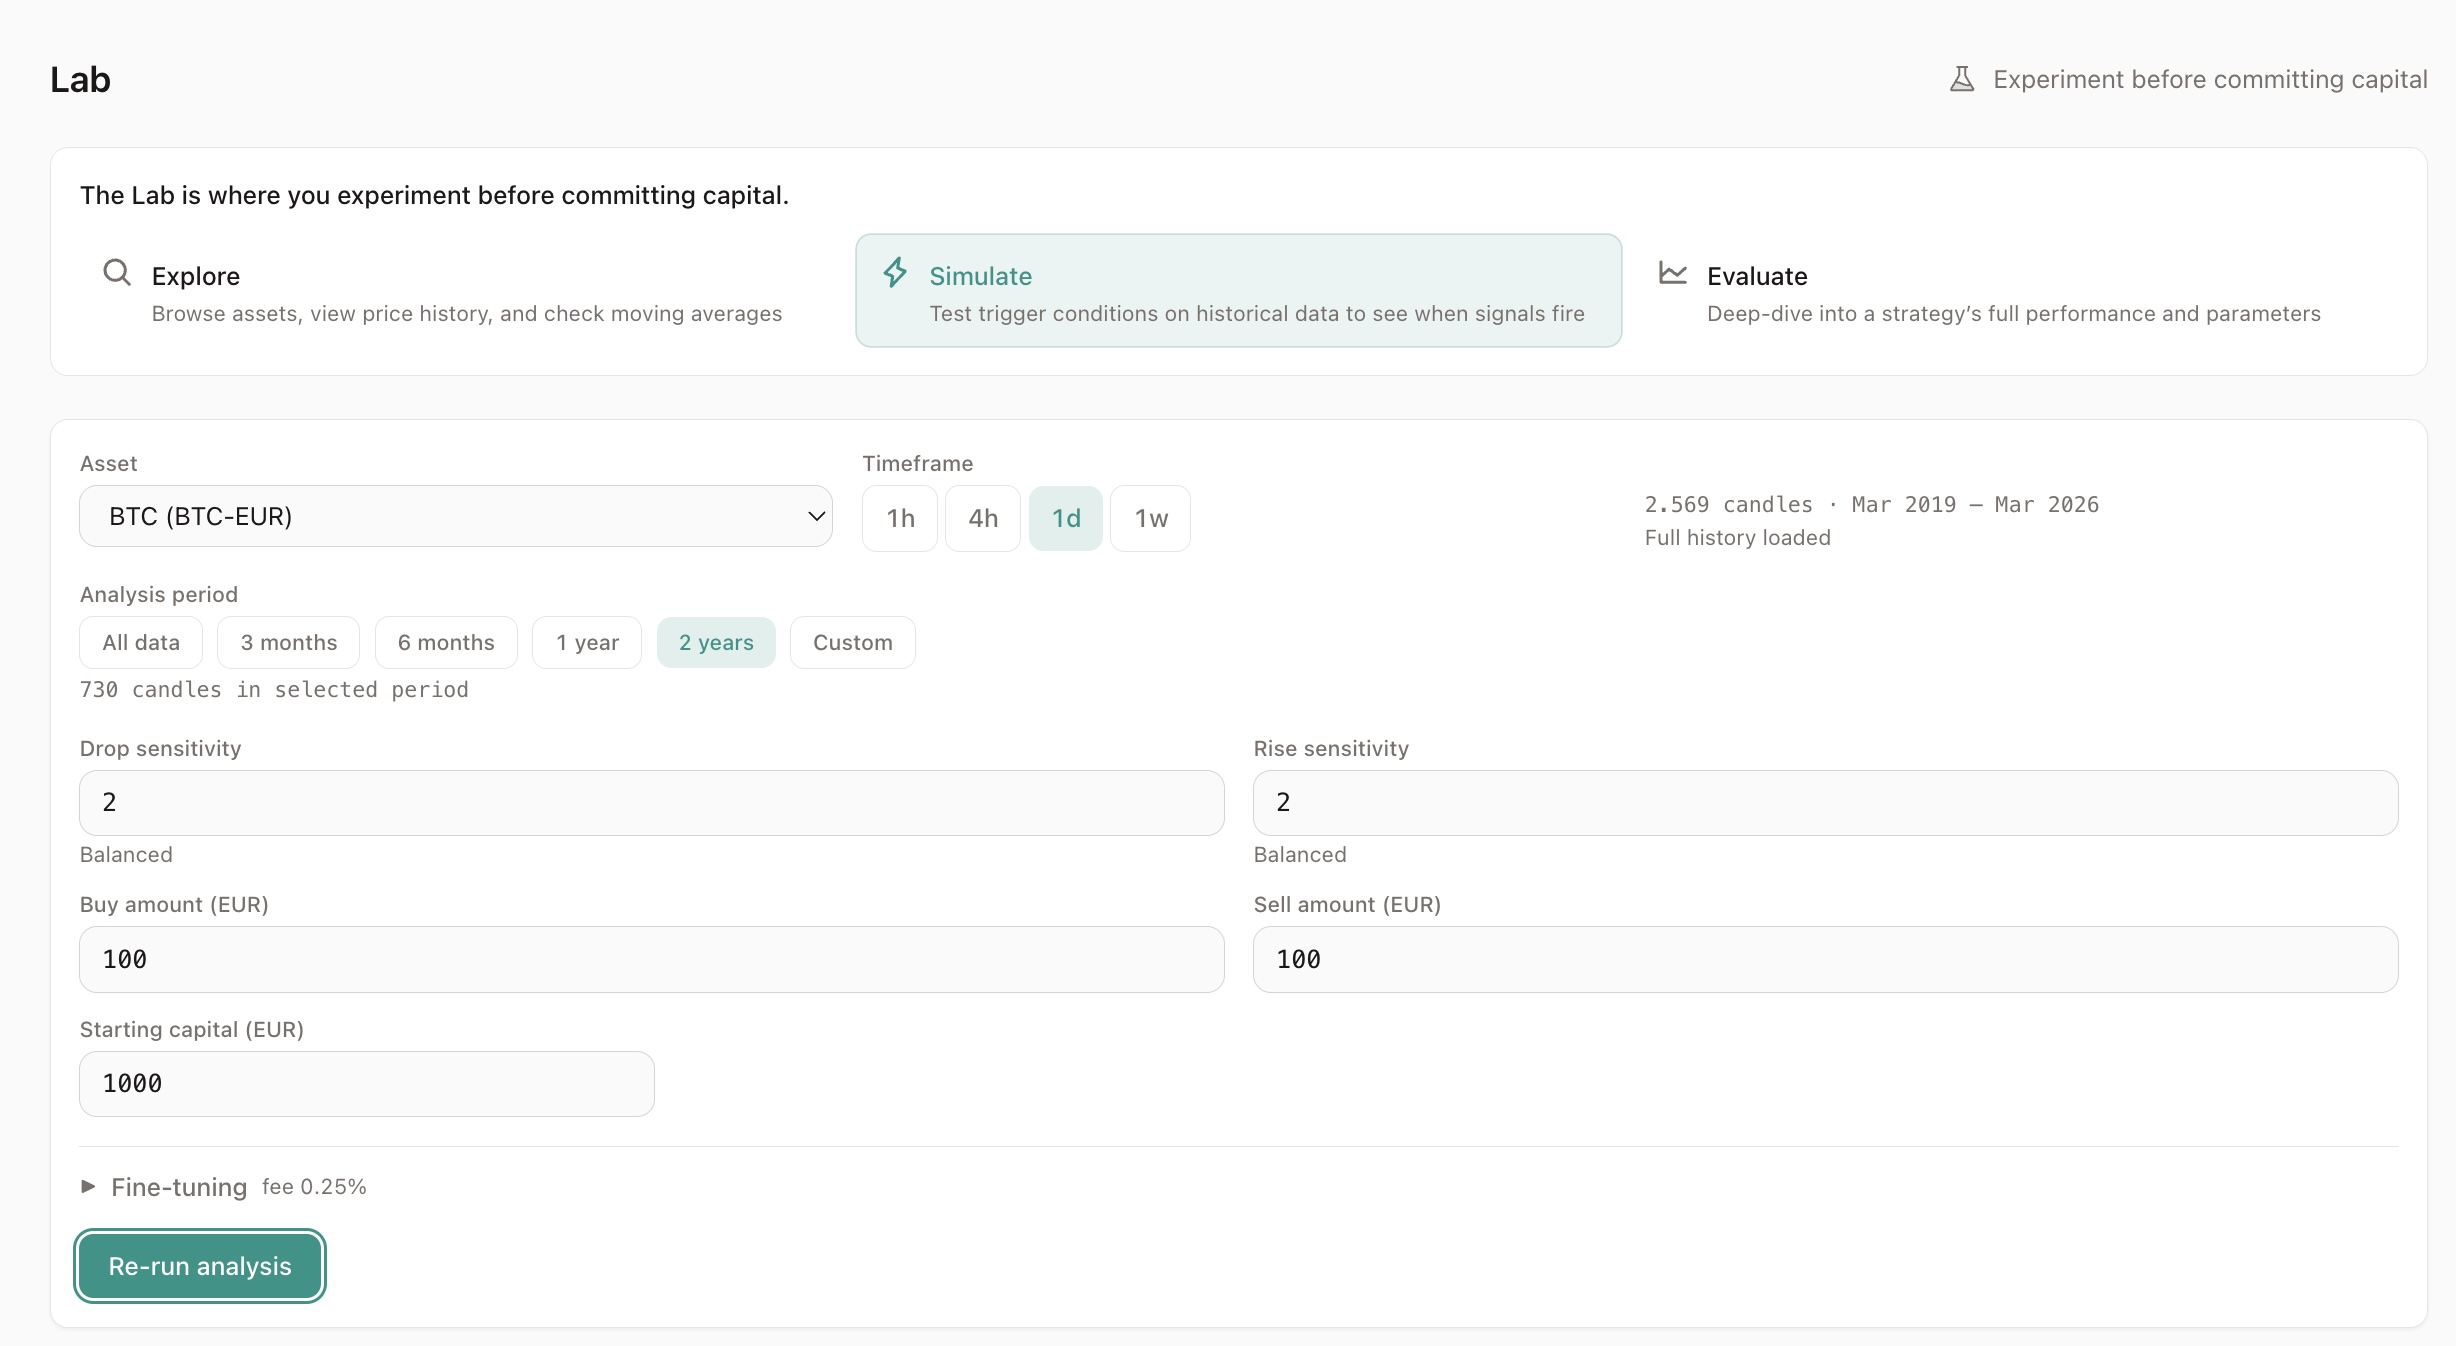
Setting Up a Simulation
Section titled “Setting Up a Simulation”Configure the following parameters:
| Parameter | What it controls |
|---|---|
| Asset | The trading pair to simulate (e.g. BTC-EUR) |
| Timeframe | Candle duration (1h, 4h, 1d) |
| Drop sensitivity | How much price must drop to trigger a buy (sigma) |
| Rise sensitivity | How much price must rise to trigger a sell (sigma) |
| Buy amount | EUR spent per buy order |
| Sell amount | EUR received per sell order |
| Starting capital | Total EUR allocated to the strategy |
| Fee % | Exchange fee per trade (default 0.25%) |
If you navigated from the Explore tab, the asset and timeframe are pre-filled.
Reading the Results
Section titled “Reading the Results”Results appear in layers, from simple to detailed:
Verdict (top level)
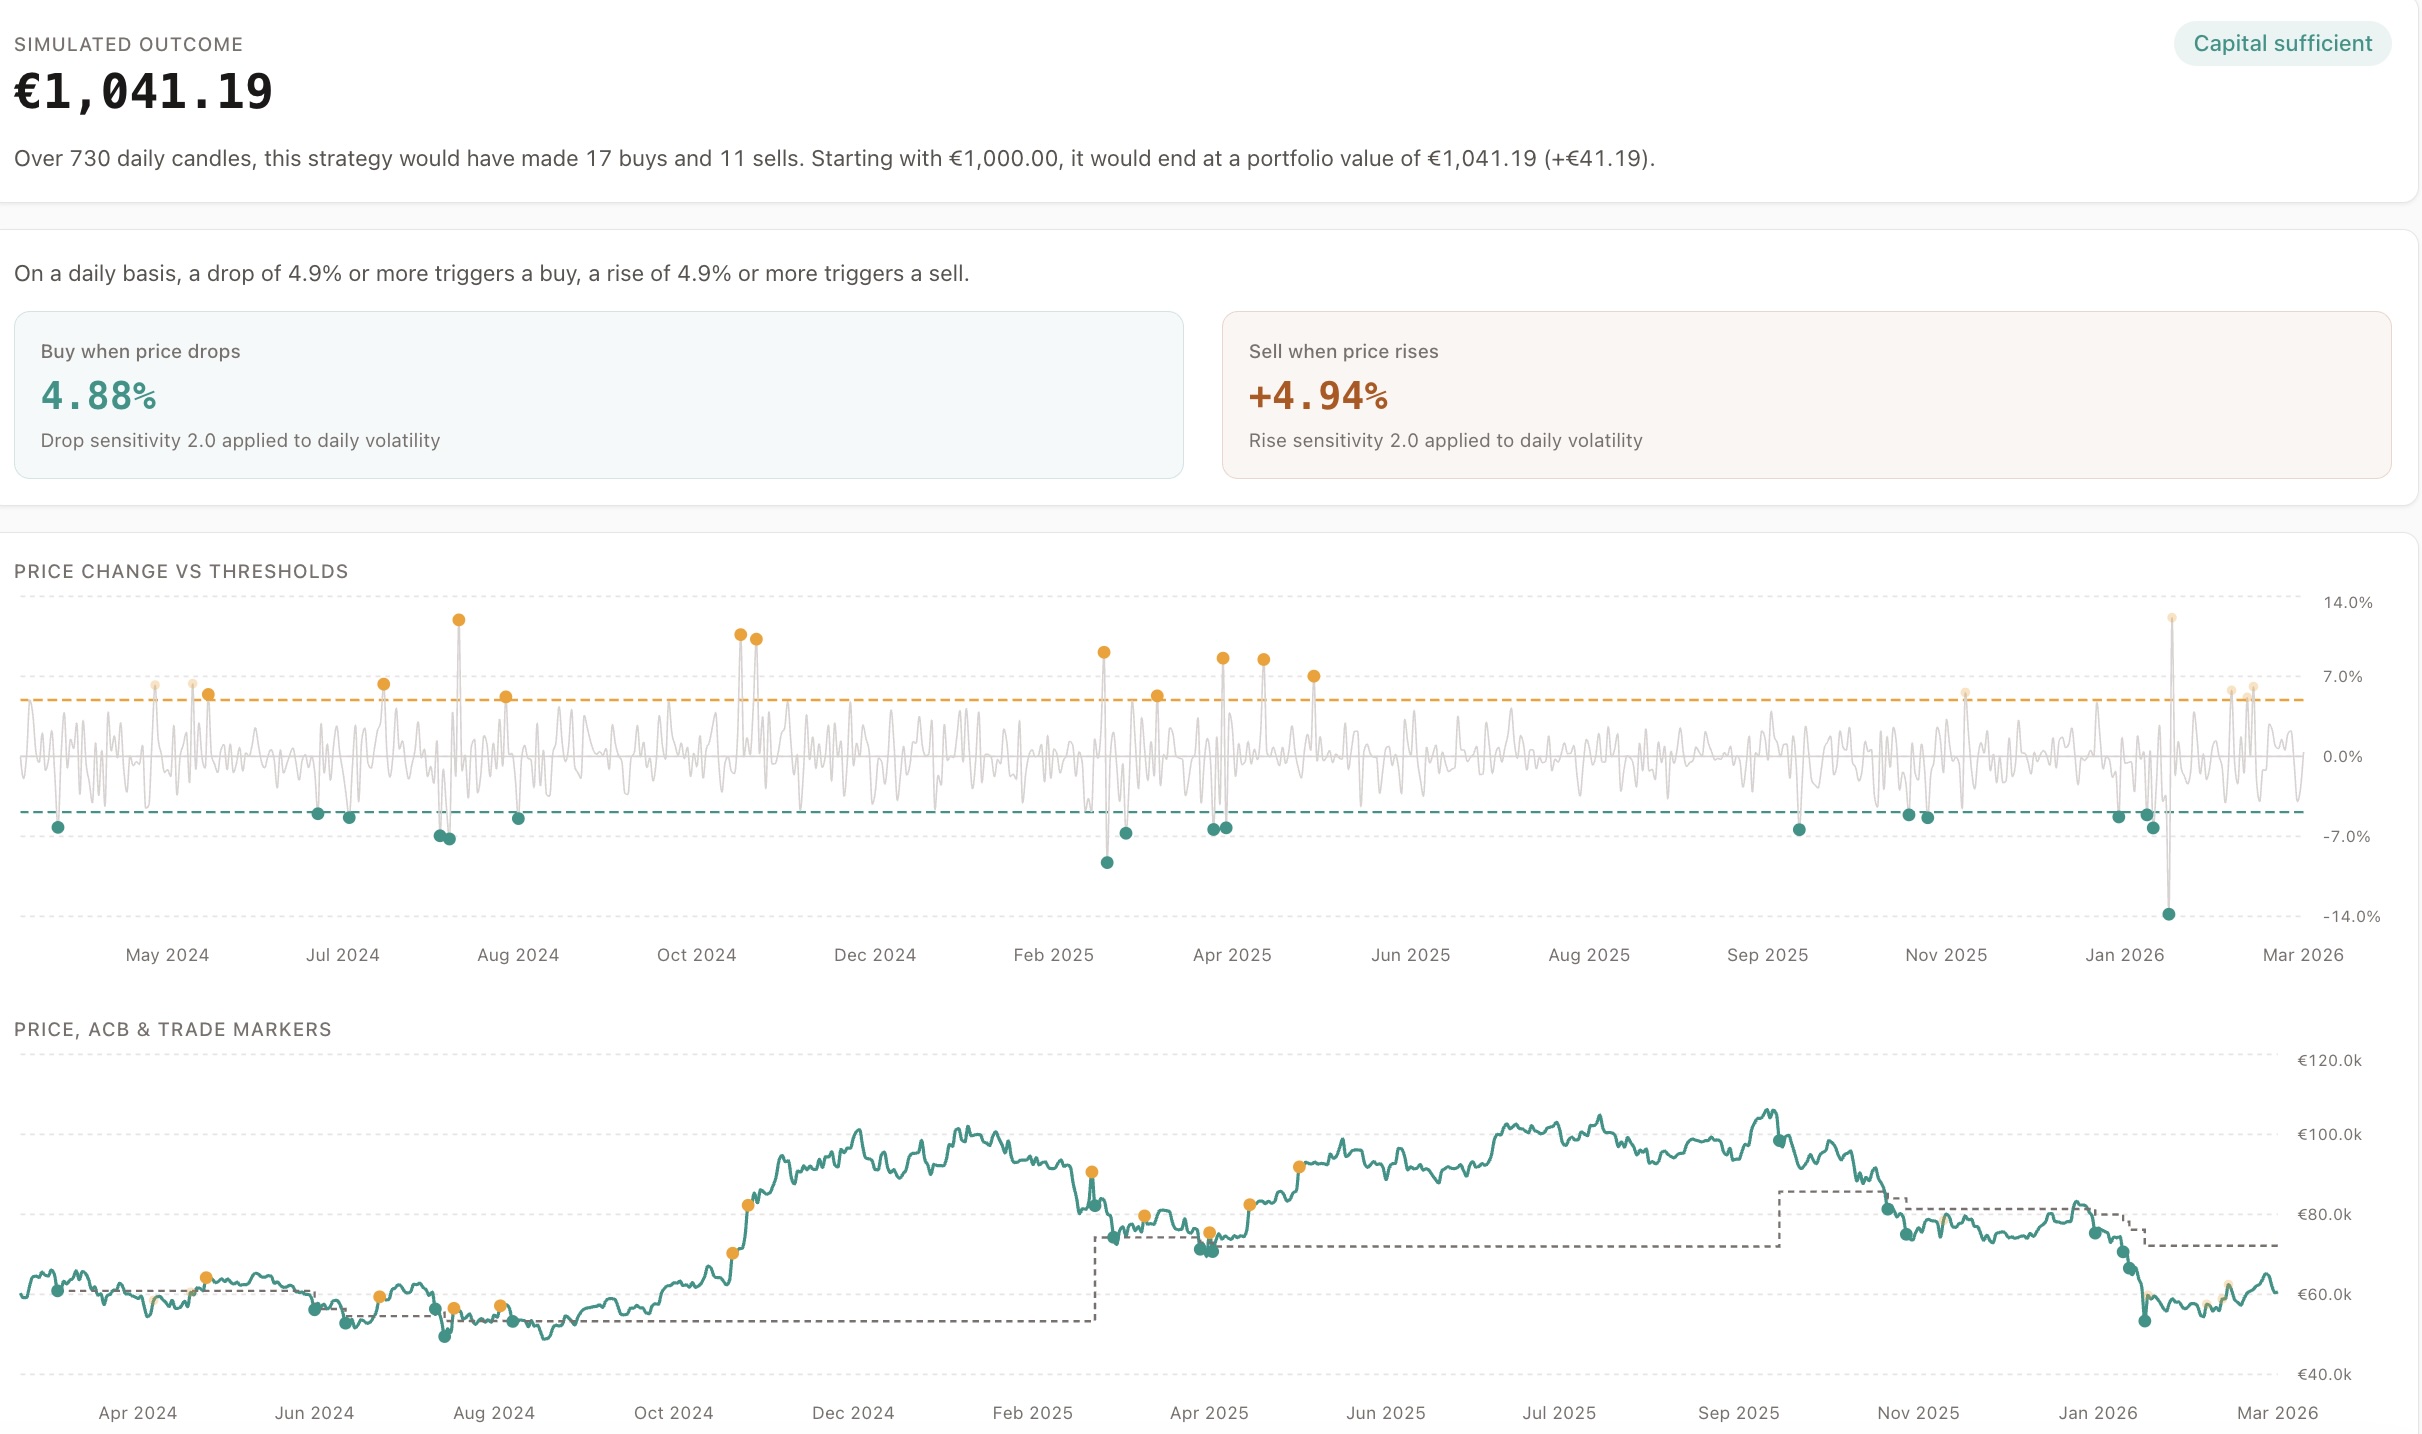
Section titled “Verdict (top level)”The hero number: portfolio end value. This is the single most important number.
Below it:
- Capital safety badge: safe or insufficient
- Summary sentence: “Over 1,440 daily candles, this strategy would have made 10 buys and 5 sells.”
Computed Thresholds
Section titled “Computed Thresholds”Two boxes showing the calculated buy and sell thresholds:
- Buy threshold (e.g. -4.2%) - “A drop of 4.2% or more triggers a buy”
- Sell threshold (e.g. +6.1%) - “A rise of 6.1% or more triggers a sell”
These are derived from the sigma values and the asset’s historical volatility.
Performance Comparison
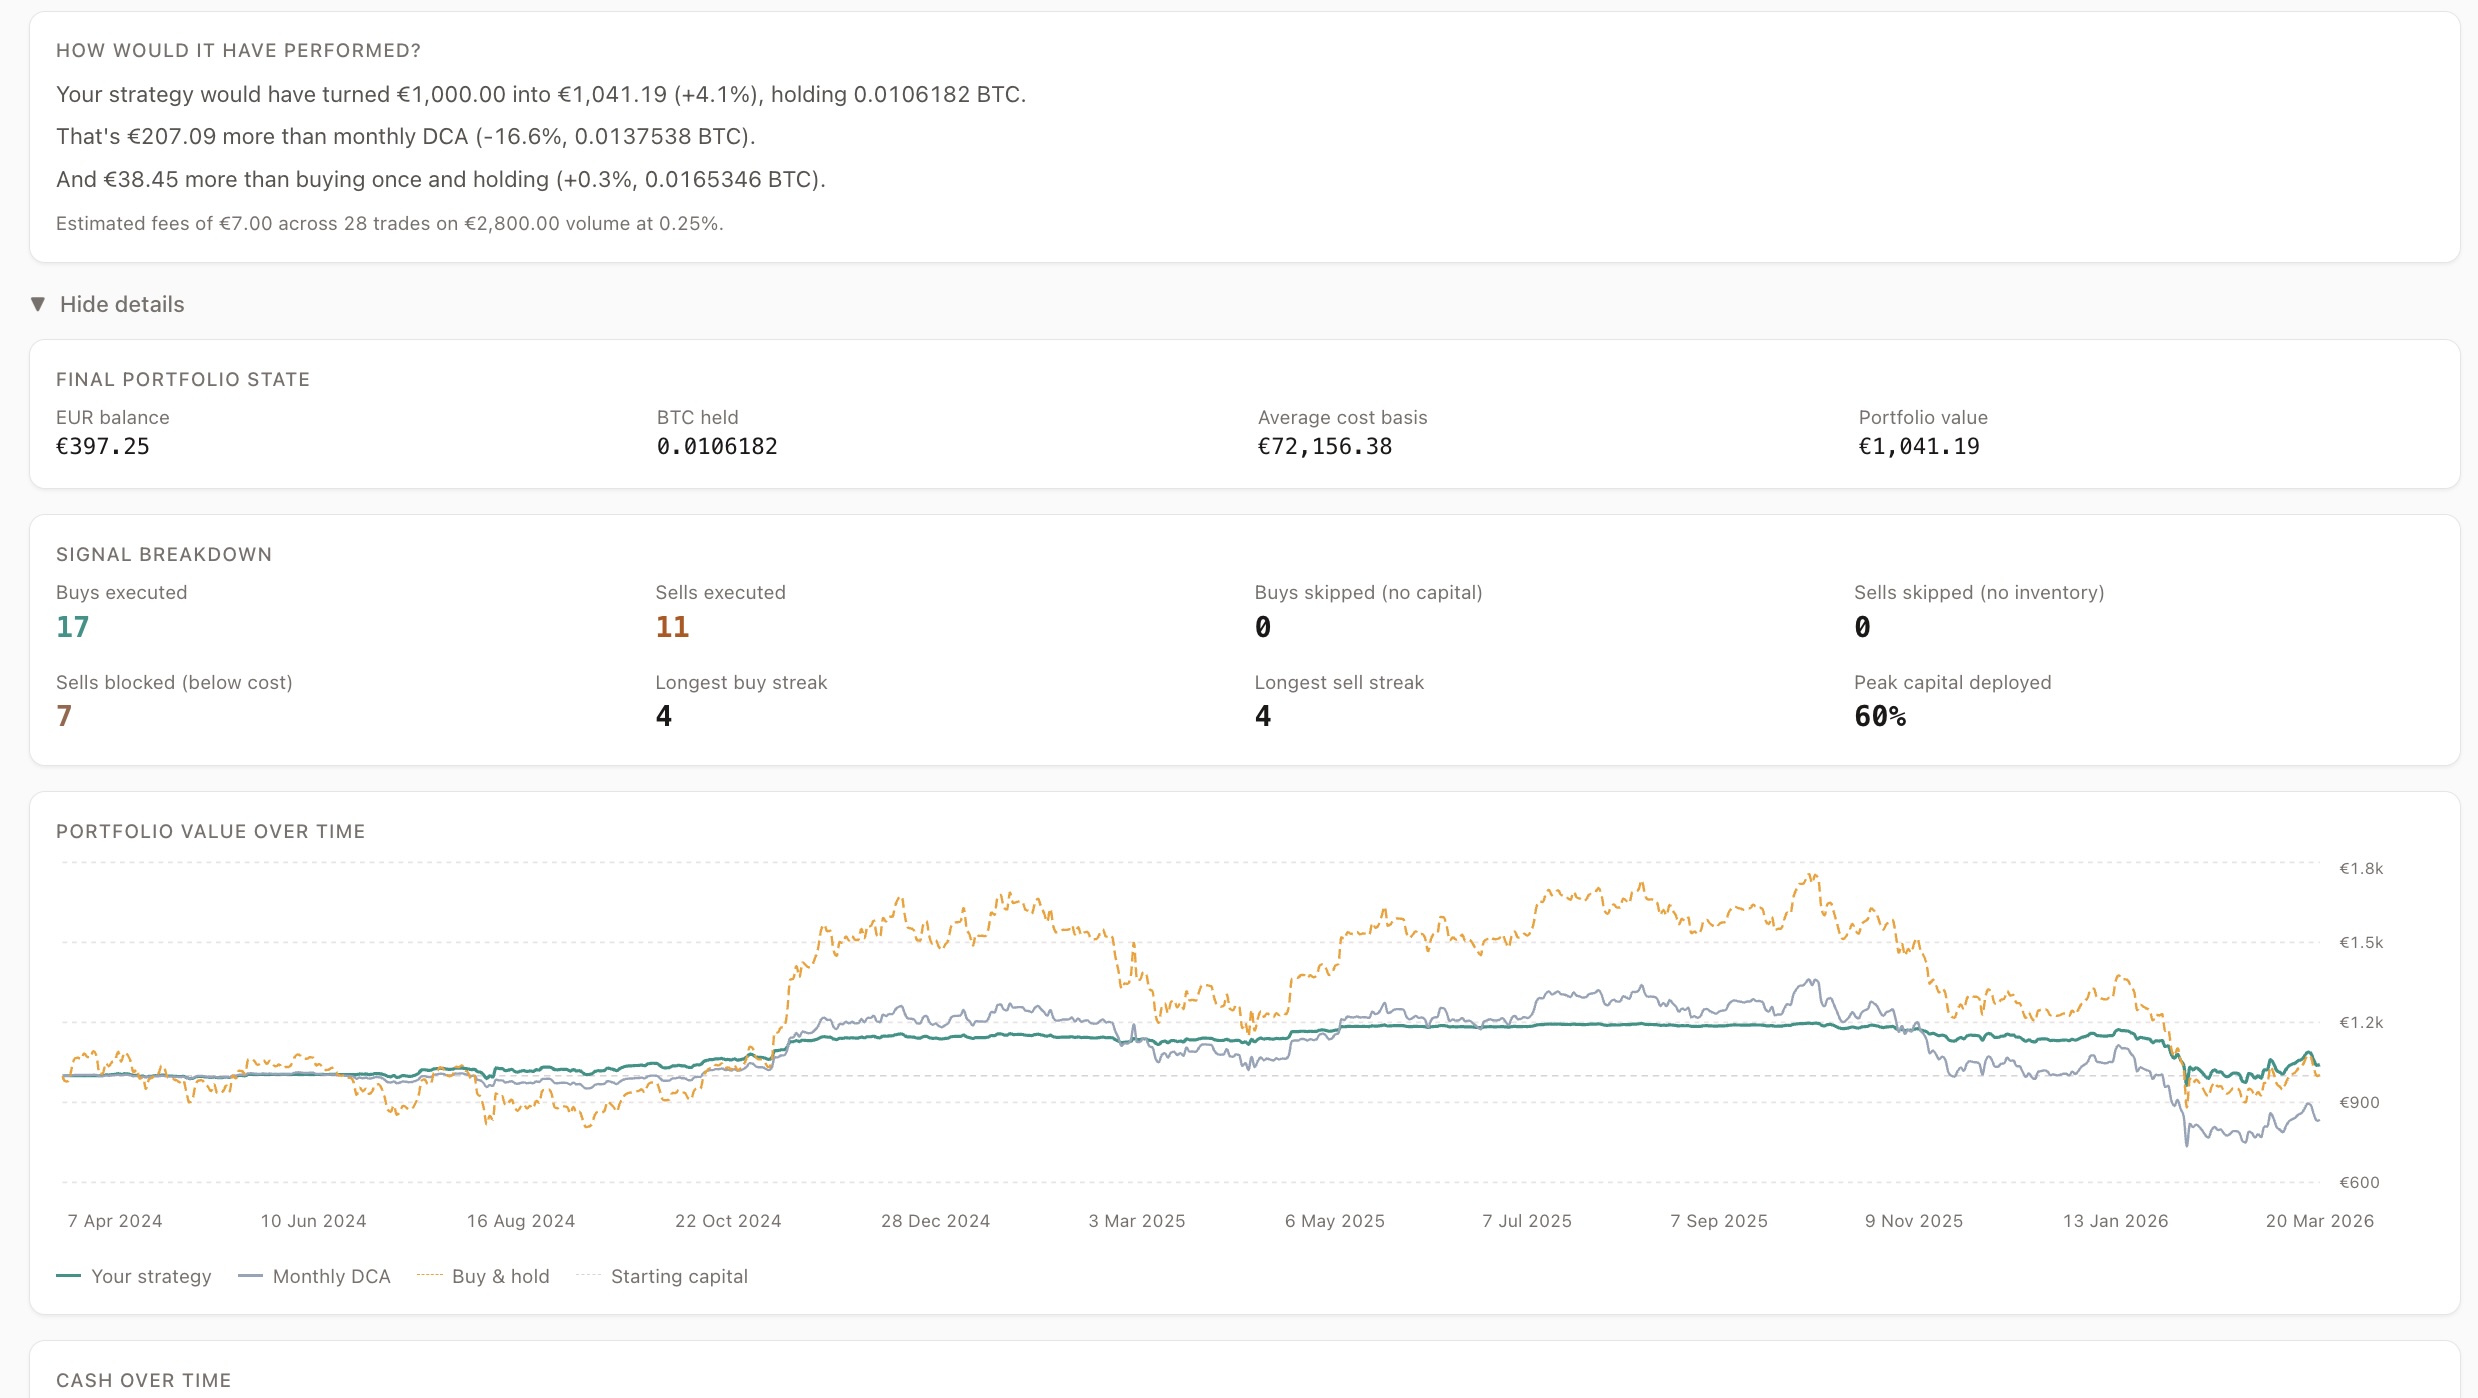
Section titled “Performance Comparison”Your strategy compared to two benchmarks:
- Monthly DCA - buying a fixed amount every month
- Buy and hold - buying once at the start
This shows whether the strategy’s active management adds or loses value compared to simpler approaches.
Fee impact is shown transparently.
Charts
Section titled “Charts”Two-panel chart:
- Top panel - candle-to-candle price change with buy/sell threshold lines
- Bottom panel - price chart with trade markers and ACB line
Trade markers:
- Solid dots - executed trades
- Faded dots - ignored trades (blocked by capital, ACB, or inventory rules)
Narrative
Section titled “Narrative”A “What happened” section that surfaces problems in plain language:
- Capital ran out during a buy cluster
- Sells were blocked because price was below ACB
- Inventory was insufficient for sell triggers
If everything looks healthy, you get a clean bill of health.
Expandable Details
Section titled “Expandable Details”For deeper analysis:
- Signal breakdown (how many buys/sells executed vs ignored)
- Portfolio state over time
- Equity curve (strategy vs DCA vs buy & hold)
- Cash-over-time chart with danger zone
Understanding Ignored Triggers
Section titled “Understanding Ignored Triggers”Not every signal results in a trade. The simulation shows exactly why:
Buy triggers ignored because:
Section titled “Buy triggers ignored because:”- Insufficient capital - allocated capital is fully deployed
- Signal clustering - multiple buy signals arrive faster than capital recycles
Sell triggers ignored because:
Section titled “Sell triggers ignored because:”- ACB protection - price is below the average cost base (Aurono never sells at a loss)
- No inventory - nothing to sell yet
Ignored triggers are not bugs - they are safety constraints working as designed.
Suggestions
Section titled “Suggestions”If the simulation reveals issues, suggestion cards appear:
- “Capital insufficient - try raising buy sigma to reduce trigger frequency”
- “Many sells blocked by ACB - try raising sell sigma for more patience”
- “Idle capital - try lowering buy sigma to deploy capital faster”
Click a suggestion to re-run instantly with adjusted parameters.
Creating a Strategy from Simulation
Section titled “Creating a Strategy from Simulation”When you are satisfied with the results, click “Create strategy”. This navigates to the strategy creation form with all parameters pre-filled:
- Symbol and timeframe
- Buy and sell amounts
- Allocated capital
- Computed drop and rise percentages
Key Principles
Section titled “Key Principles”- The simulation uses the same logic as Aurono’s live engine
- All computation runs client-side - no backend calls needed
- Results are deterministic - same parameters always produce the same outcome
- The tool answers: “Can this strategy survive its own rules?” - not “Will this make money?”