Dashboard Overview
The Dashboard is your home screen in Aurono. It shows everything you need to know about your portfolio and strategies at a glance.
Portfolio Value
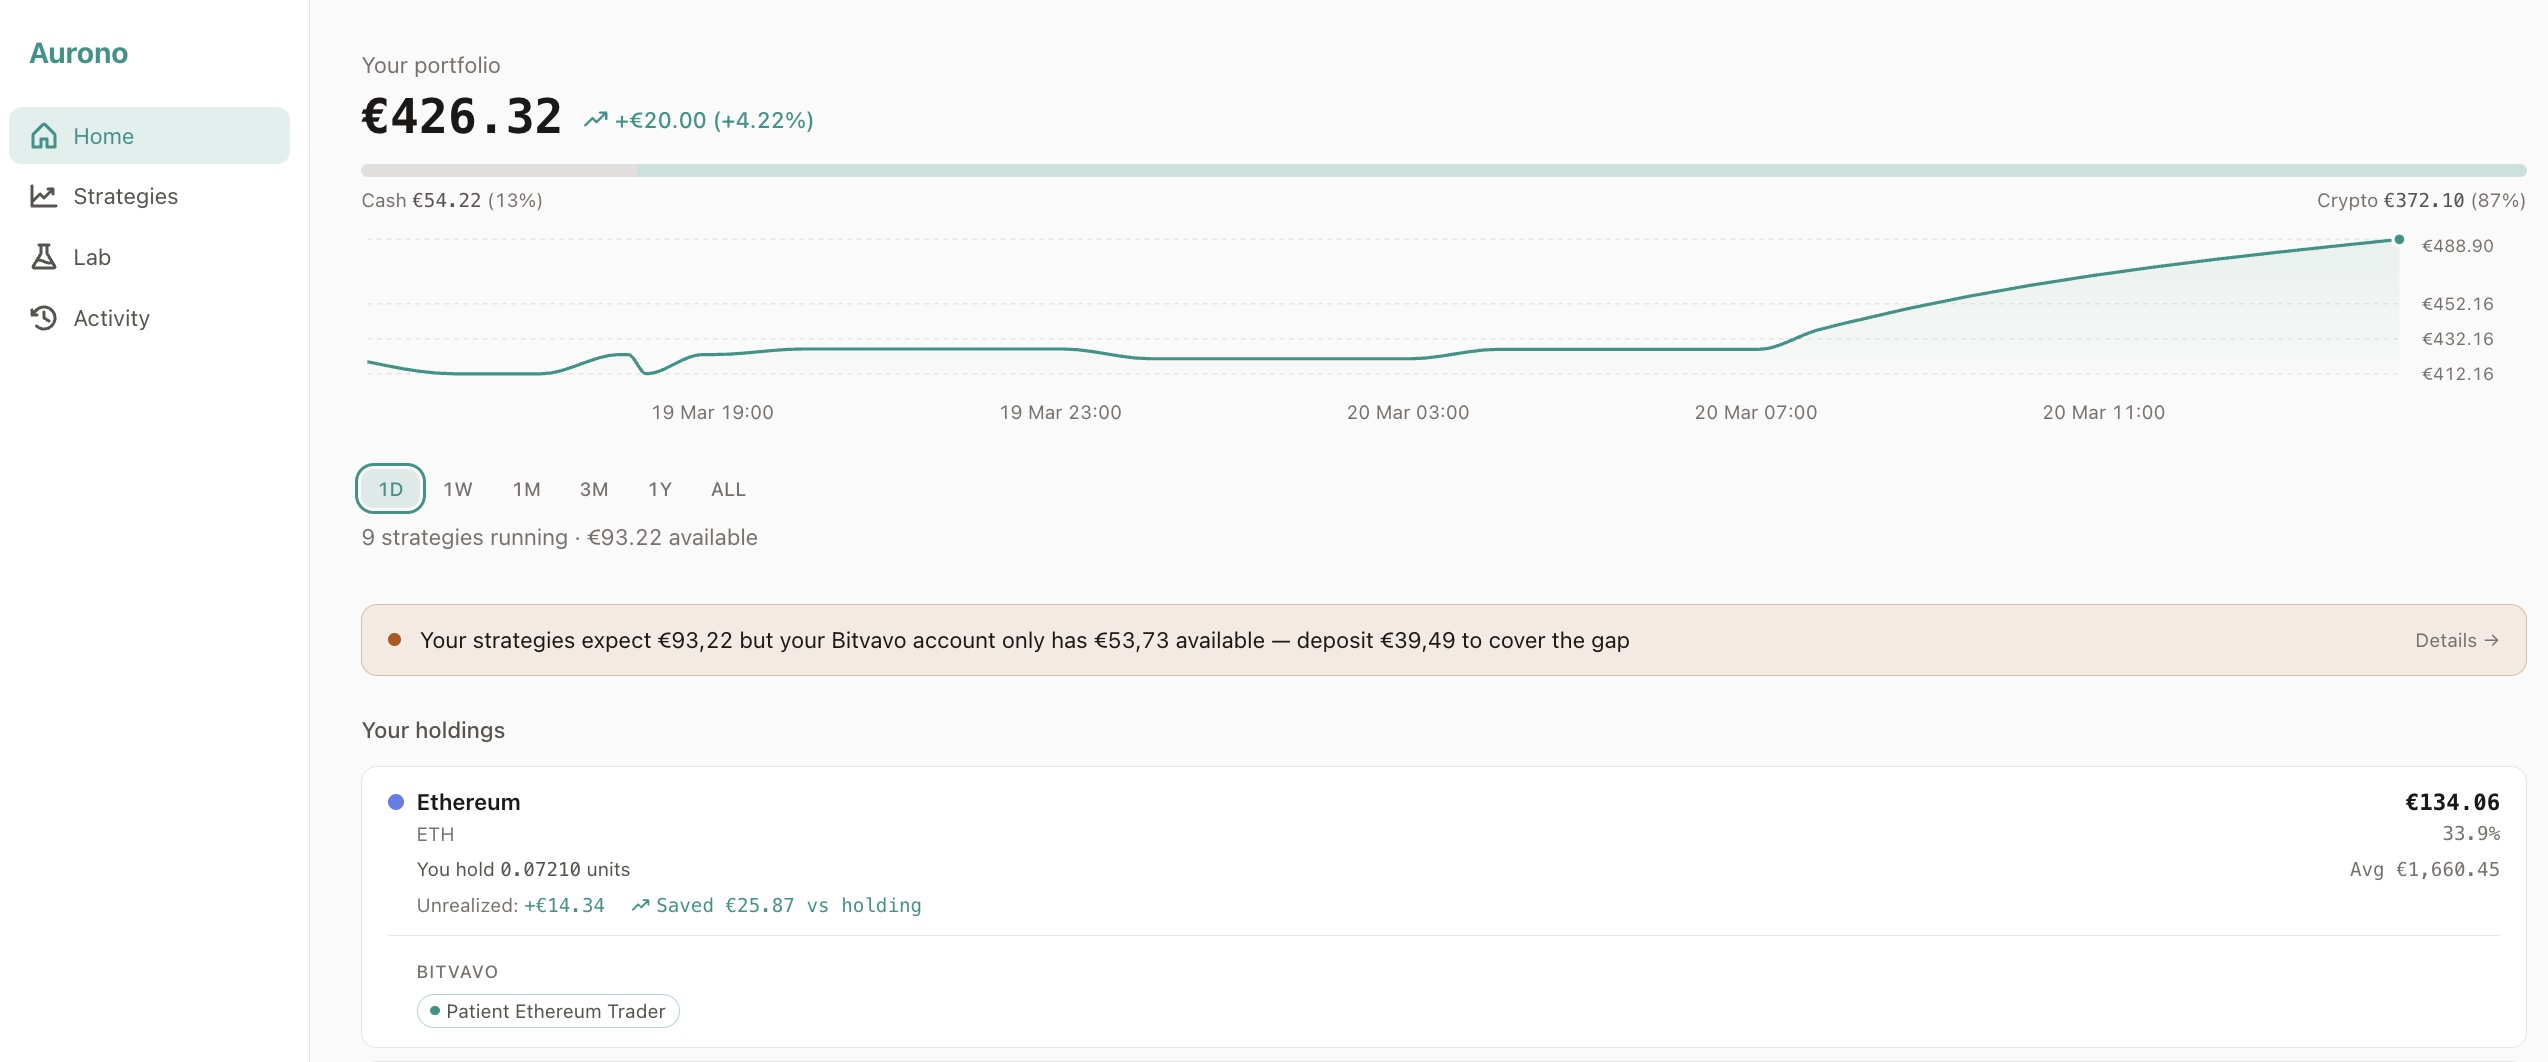
Section titled “Portfolio Value”The top of the page shows your total portfolio value as a single hero number - the combined worth of all your running strategies (cash + crypto positions at current market prices).
Below it you see:
- P&L trend - the total profit or loss as an amount and percentage (e.g. ”+€234 (+2.3%)”)
- Active strategies count and available cash - how many strategies are running and how much EUR is free to trade
- Cash/Crypto bar - a visual split showing how much of your portfolio is in EUR cash vs crypto holdings
Portfolio Chart
Section titled “Portfolio Chart”An interactive chart plots your portfolio value over time. You can select a time range:
- 1D / 1W / 1M / 3M / 1Y / ALL
Hover over the chart to see the exact value, cash, and crypto amounts at any point. The hero number and composition bar update as you hover, so you can explore how your allocation changed over time.
Liquidity Warning
Section titled “Liquidity Warning”If your exchange has less EUR available than your active strategies need, an amber banner appears below the chart:
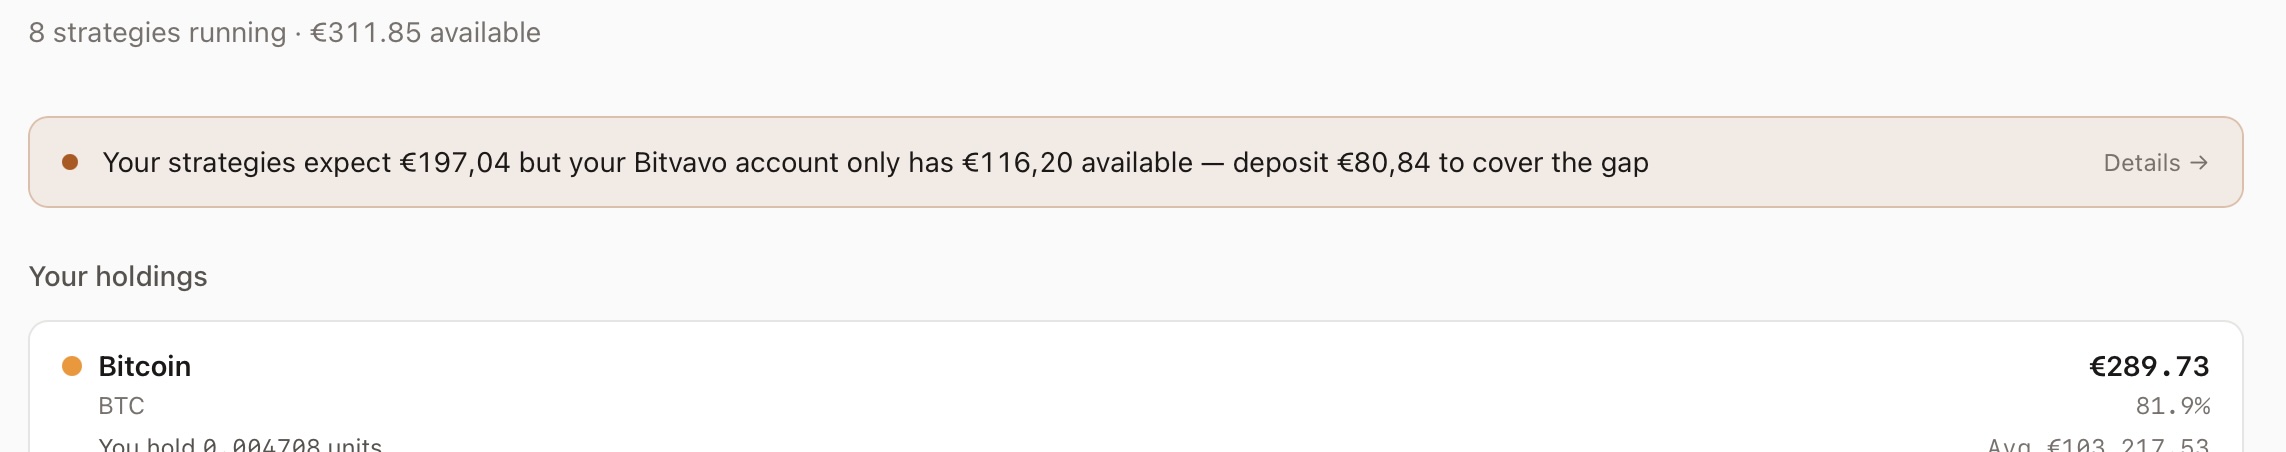
The banner adds up what your active strategies expect to spend and compares it to the actual EUR sitting on each exchange. If the strategies want more than the exchange has, you’ll see exactly how much to deposit to close the gap. Paused and archived strategies don’t count - pause everything and the banner disappears.
Clicking the warning takes you to Settings, where you can see the full exchange balance breakdown.
Your Holdings
Section titled “Your Holdings”The holdings section shows your crypto positions grouped by asset (e.g. BTC, ETH). Each holding card shows:
- Units and EUR value - how much you own and what it’s worth at current prices
- Unrealized P&L - how much you’re up or down on this position
- Saved vs holding - compares your Aurono strategy performance against simply buying and holding
- Strategy breakdown - which strategies hold this asset, on which exchange. Click any strategy tag to go directly to its Evaluate tab
If any asset has a shortfall on the exchange (the exchange holds fewer units than your strategies expect), a warning appears on the card.
Monthly P&L
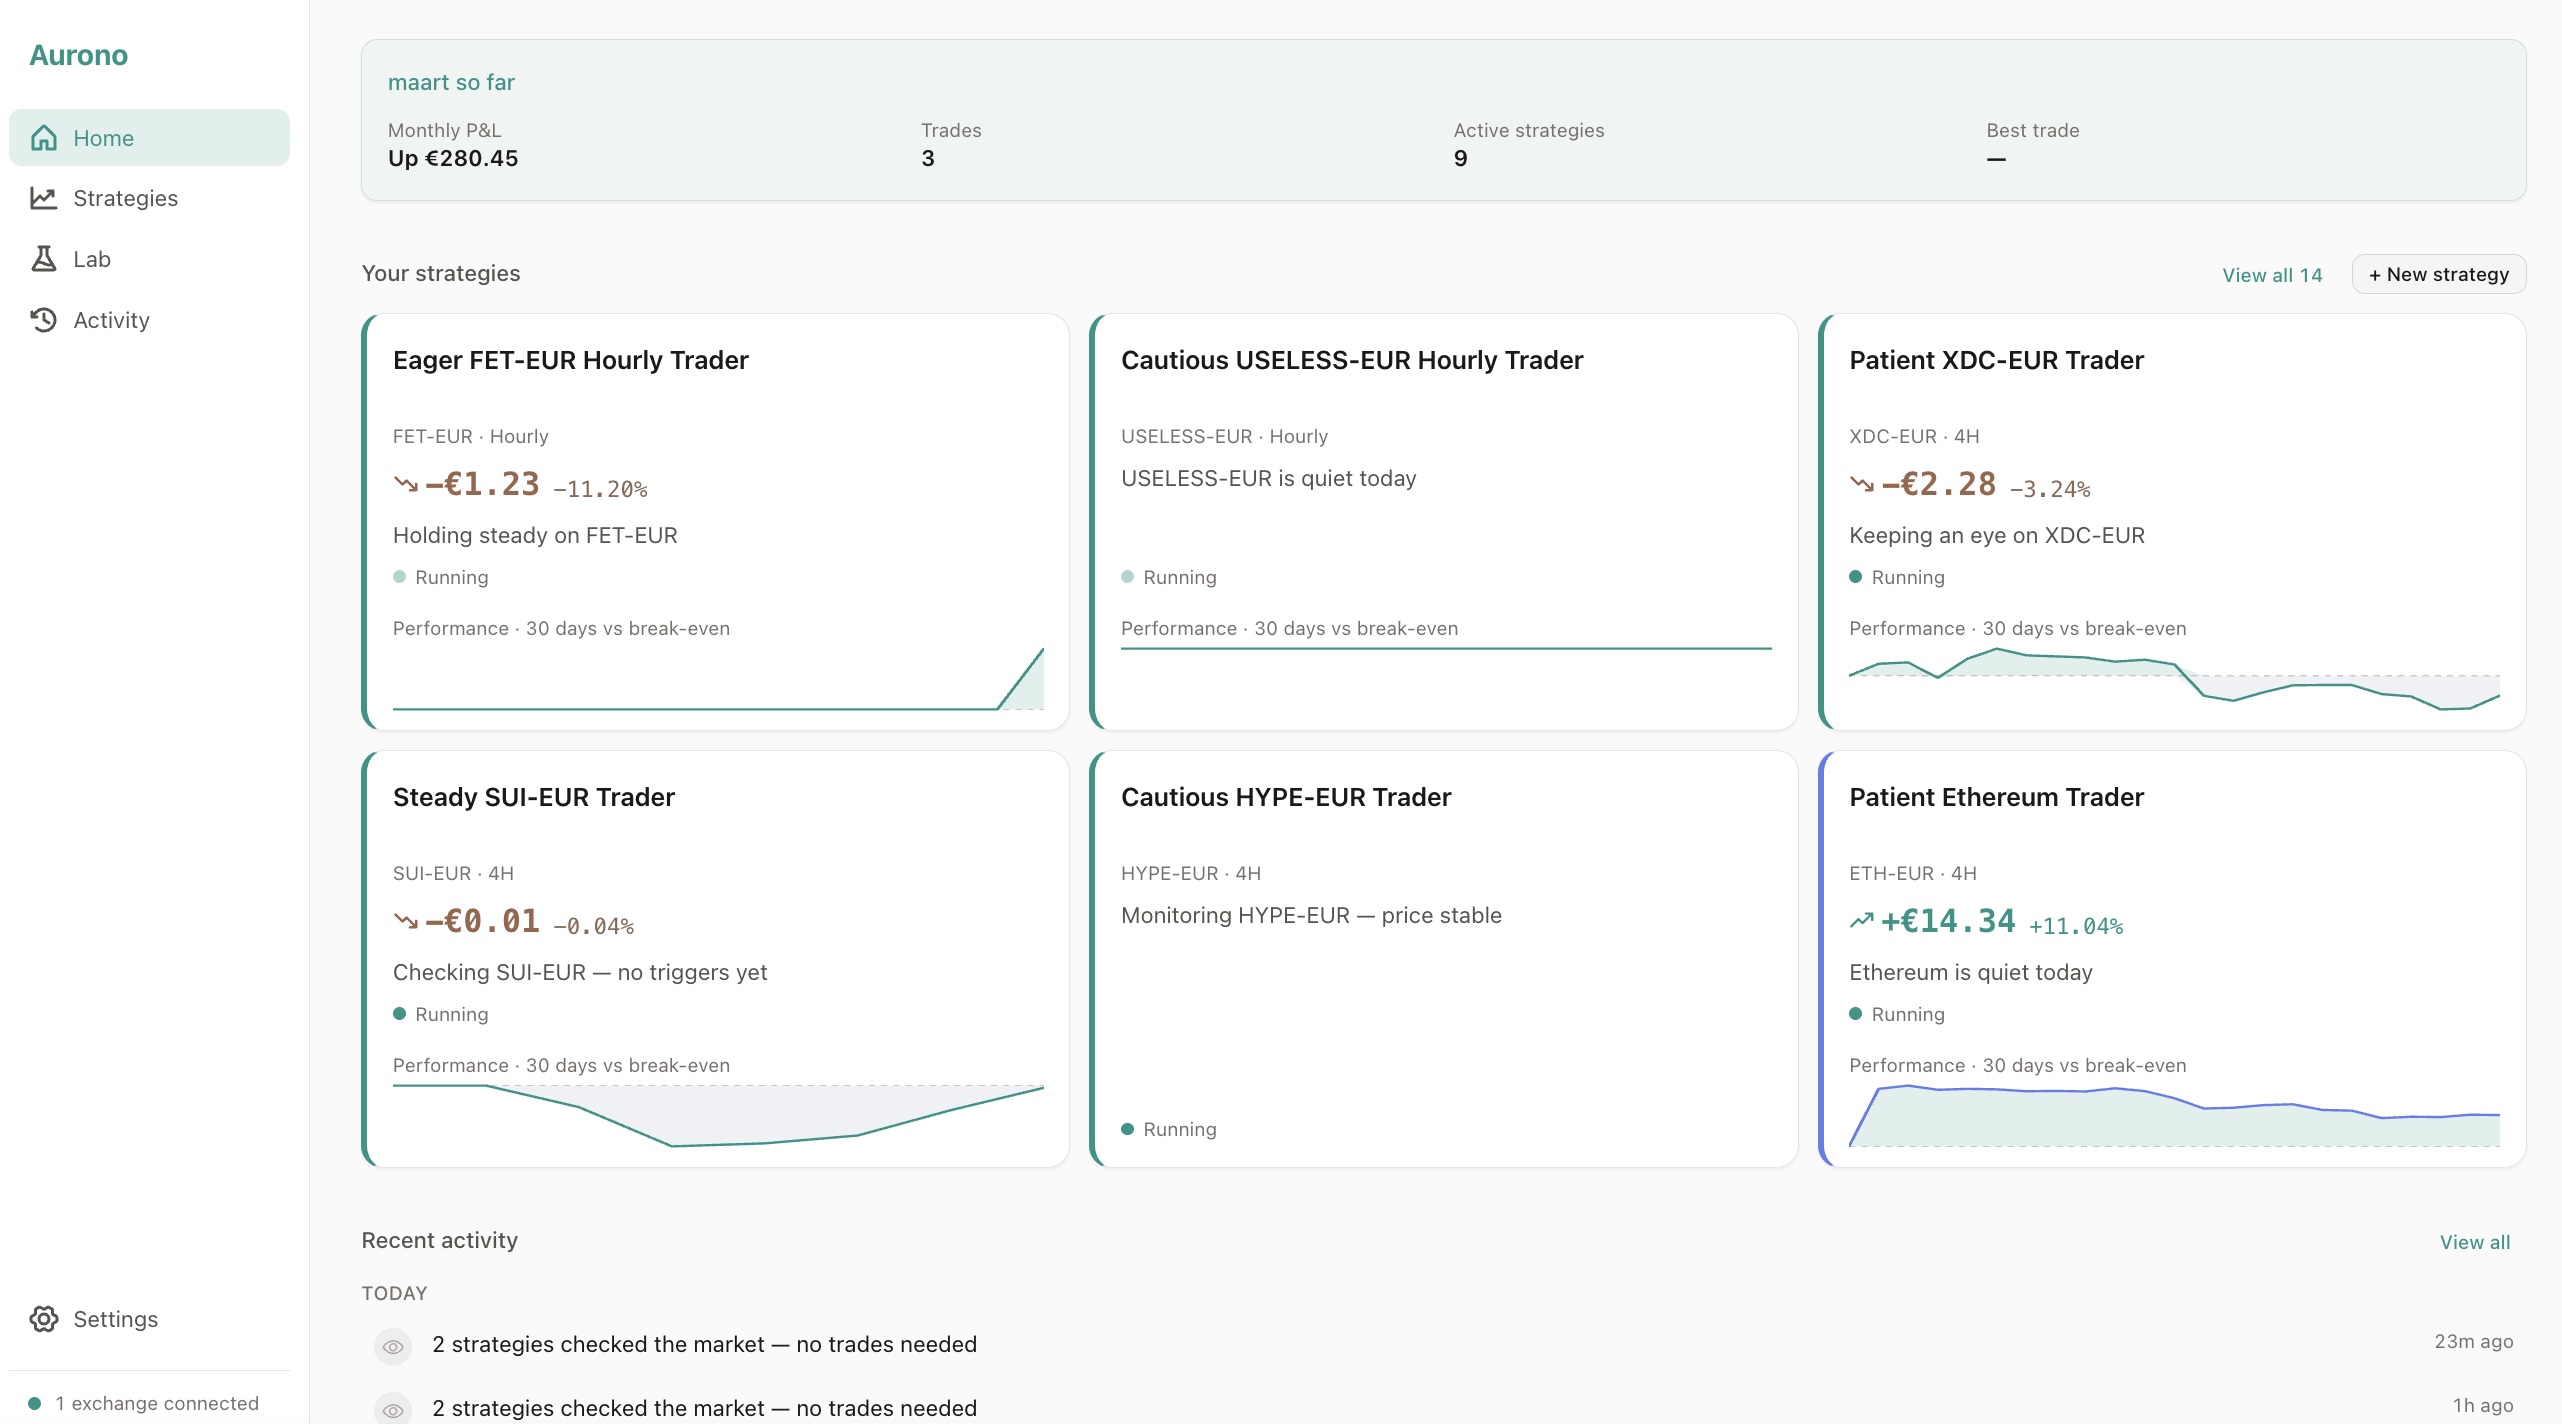
Section titled “Monthly P&L”A summary card for the current month, showing:
- Portfolio change - how much your portfolio value moved this month (excluding deposits and withdrawals)
- Trades - how many trades completed this month
- Active strategies - how many are currently running
- Best trade - the largest single trade amount this month
This card appears once you have at least one trade or a week of snapshot data.
Your Strategies
Section titled “Your Strategies”Up to six strategy cards appear, sorted by most recently evaluated. Each card shows:
- Strategy name - auto-generated from the asset if you didn’t set one
- Asset, timeframe, and exchange - e.g. “BTC-EUR - Daily - Bitvavo”
- Status - running or on hold
- Total P&L - realized + unrealized, as amount and percentage
- Performance sparkline - a 30-day mini chart showing P&L trend vs break-even
- Status sentence - a human-readable summary like “Bought 0.0012 BTC 3 hours ago”
- Milestone badges - achievements like “First round trip” or “ATH”
If you have more than six strategies, a “View all” link takes you to the Strategies page.
Click any card to go directly to the strategy’s Evaluate tab in the Lab, where you can see performance, trigger parameters, benchmarks, and trade history.
Recent Activity
Section titled “Recent Activity”The bottom of the Dashboard shows the last five meaningful events in plain language - trades, decisions, strategy changes, and milestones. Internal system events are filtered out to keep the feed readable.
Click View all to go to the Activity page for the complete timeline.
Milestones
Section titled “Milestones”Aurono celebrates key moments in your strategy’s life:
- First round trip - when your first sell order completes (closing a BUY→SELL pair)
- Round-trip count - milestones at 10, 25, 50, and 100 completed round trips
- All-time high - when your portfolio value and asset holdings both exceed their previous peak (confetti included)
Milestones appear as badges on strategy cards, in the Activity feed, and as notifications on the Dashboard.
Next Steps
Section titled “Next Steps”- Strategies - manage all your strategies, filter by status, and open the detail view
- Activity - see a timeline of everything Aurono has done
- Settings - manage exchange connections, reports, and system preferences
For deeper analysis, use the Strategy Lab - explore assets, simulate strategies, and rebalance capital.