
Locking in profit while the price falls
Between 22 May and 11 June 2026, ONDO-EUR fell more than 20% from its high. A textbook bearish window - the kind of three weeks where most people quietly stop opening the app.
A patient ONDO strategy running on Aurono Start came out the other side net positive. Not because it called the bottom. Not because anyone watched the charts. Because the rules did three unglamorous things, over and over, while the price bled.
This is a case study in what that looks like.
What we’re looking at
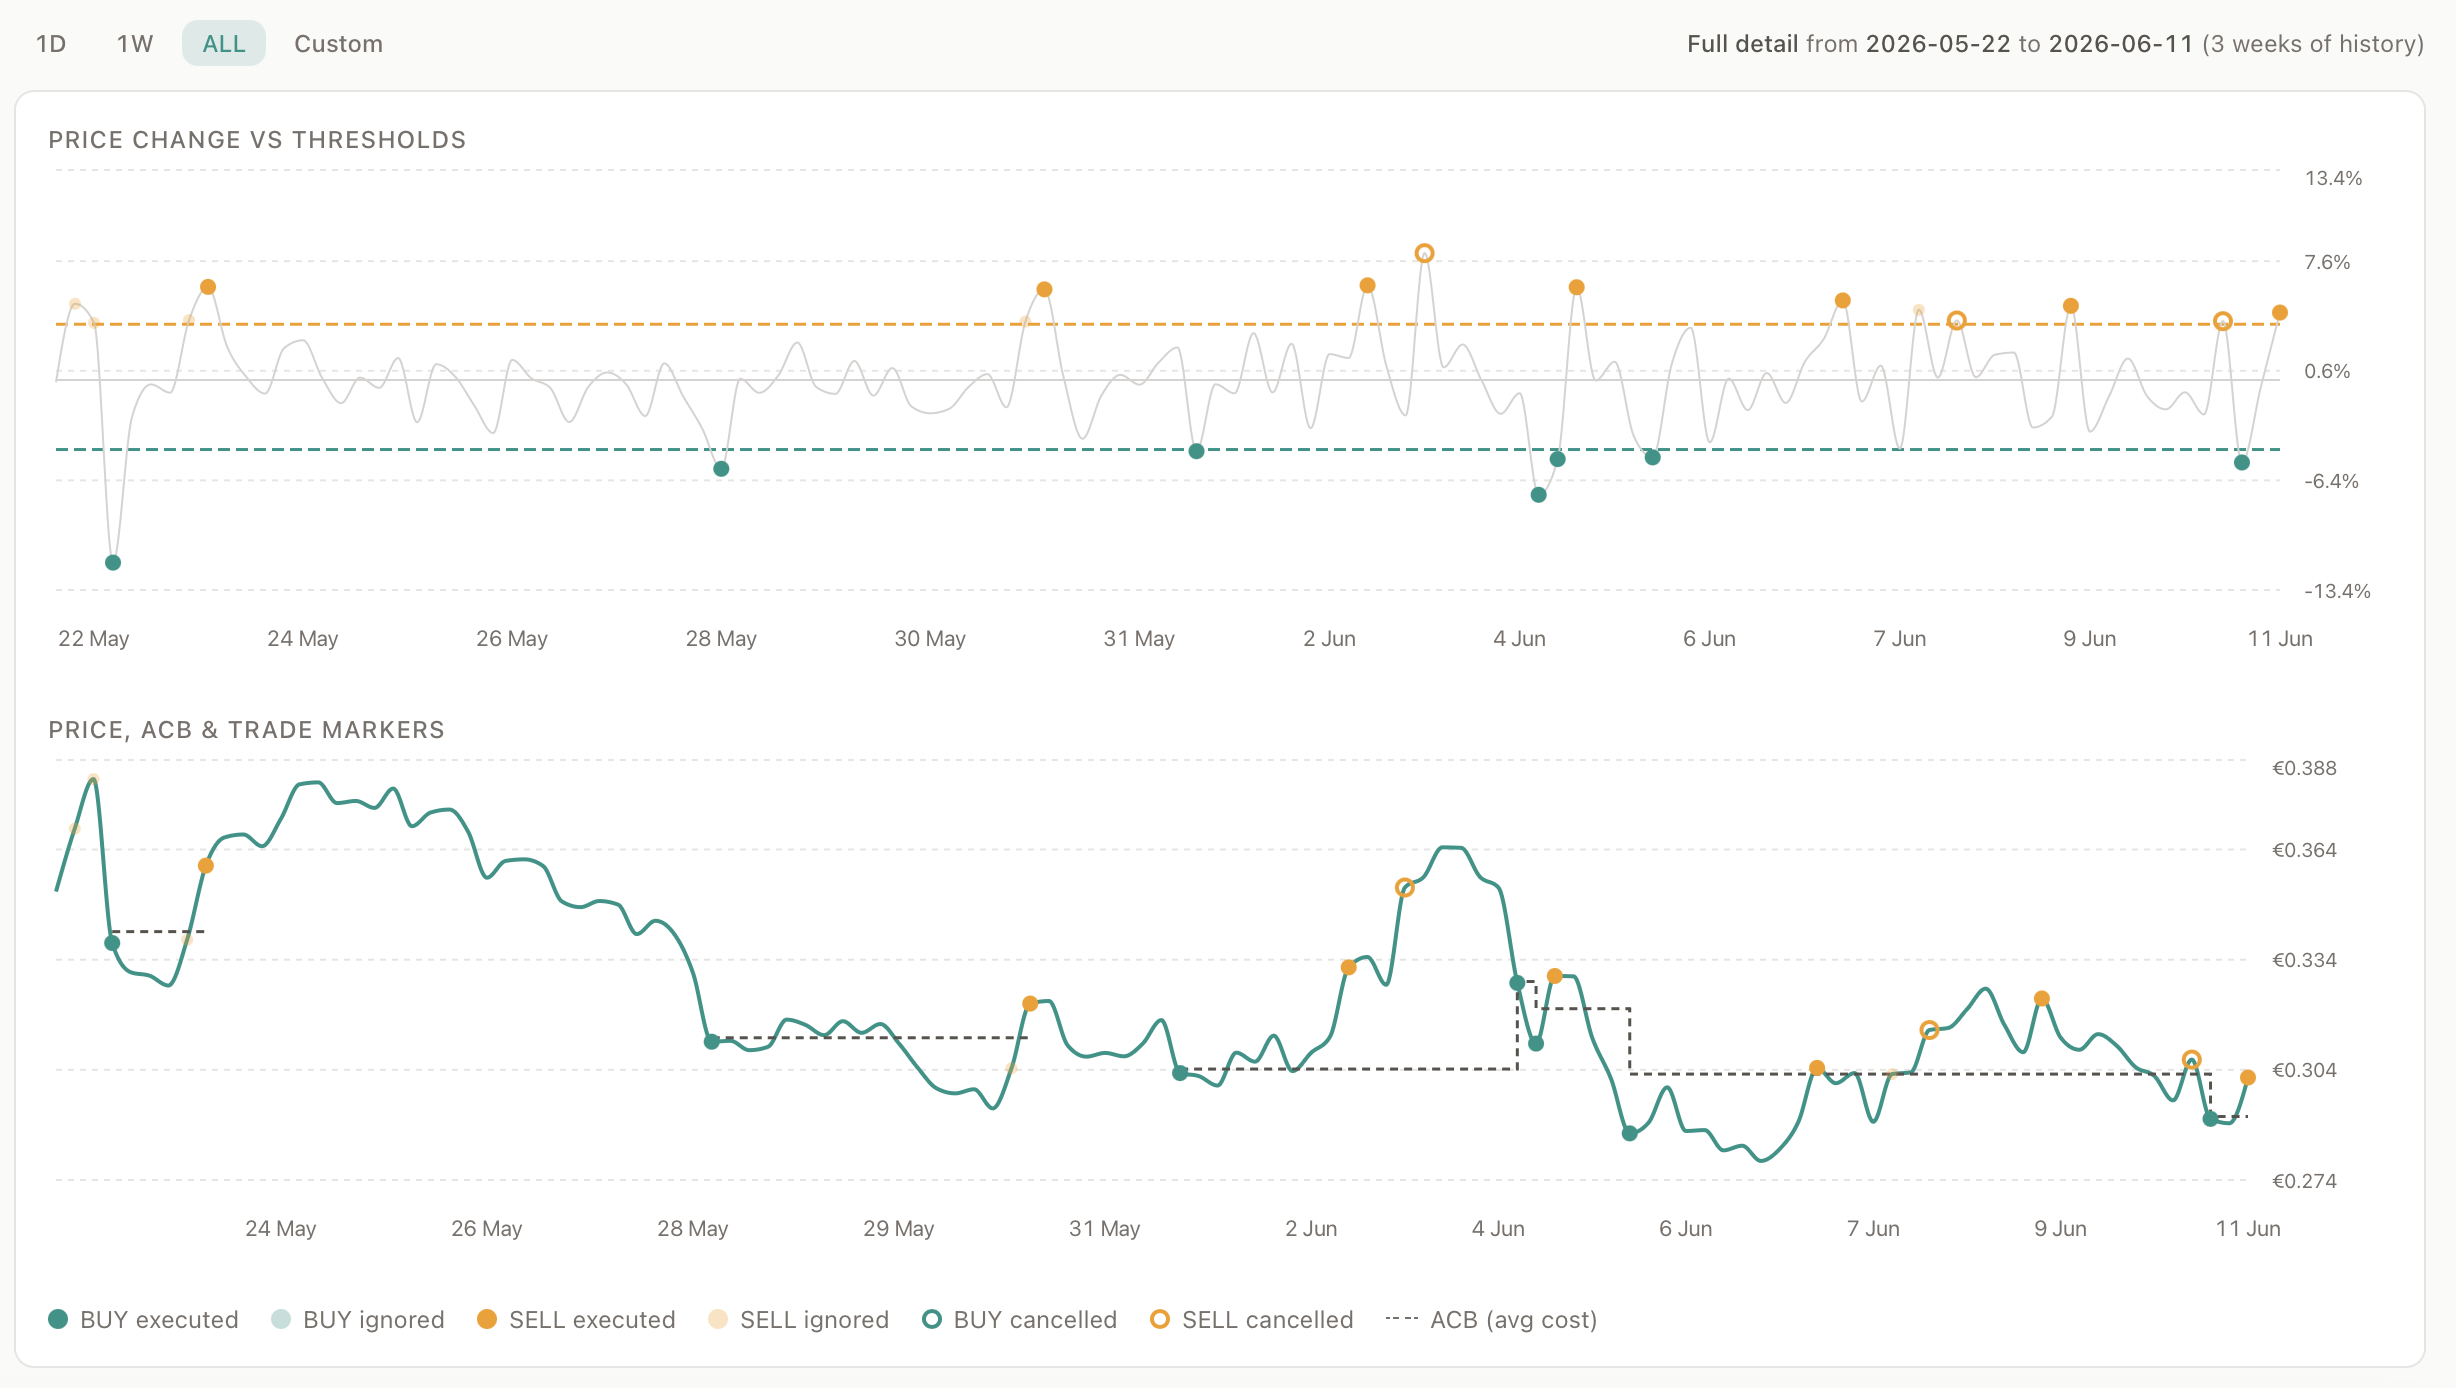
ONDO-EUR over three weeks, 22 May to 11 June 2026. The price (teal) fell more than 20%, but the dashed grey average-cost-base line stepped down with it - and the strategy kept booking round trips the whole way.
The top chart shows the 4-hour price change against the strategy’s two triggers - a sell line near +3.56% and a buy line near −4.44%. The dots are the moments a signal fired.
The bottom chart is the same three weeks in price terms. The teal line is ONDO. The dashed grey line is the ACB - the average cost base, the strategy’s true breakeven. Watch that grey line: as the price falls, it steps down with it. That single detail is the whole story.
The setup
One rule set, defined once, left alone:
- Buy when the 4-hour change drops below −4.44%.
- Sell when the 4-hour change rises above +3.56%.
- Equal amounts on each side - the strategy isn’t trying to accumulate or cash out, only to harvest the gap between buying low and selling high.
- A 4-hour evaluation cycle on Kraken.
That’s it. No price targets, no predictions, no overrides.
What “down 20%” did to the average cost base
Here is the part that runs against intuition. When the asset you hold loses a fifth of its value, you expect your breakeven to be stranded far above the price - permanently underwater, waiting for a recovery that may never come.
That is what happens if you buy once and hold.
It is not what happens when every dip below the threshold triggers another buy at a lower price. Each of those buys pulls the average cost base down. Over the three weeks, the strategy’s ACB walked from the top of the range down to €0.290920 - and the price finished slightly above that. So even after a 20%+ fall in ONDO itself, the position ended the window fractionally in the green rather than deep in the red.
The price fell. The breakeven followed it down. That is not luck; it is arithmetic, applied without flinching, on every dip the market handed over.
Banking the small gains
While the average cost base drifted down, the sell side was quietly doing its job. Across the window the strategy completed 7 round trips, each one a buy low followed by a sell high. The realised gains per trip were small and repeatable - most landed between roughly +2% and +8%, clustered around the +3.56% sell threshold, with one trip essentially flat.
None of them were home runs. That is the point. The strategy isn’t swinging for a top; it’s collecting the difference between a dip and the next bounce, again and again. Added up, those round trips recovered about 12% of the starting capital as realised profit - booked, in cash, regardless of what ONDO does next.
In a window where the asset fell more than 20%, the strategy’s realised line went up.
The guardrails: three trades it refused to make
A sell signal firing is not the same as a sale happening. Over this window the sell line was crossed 15 times and only 7 became sales. The other eight tell you as much about the strategy as the trades that executed.
It won’t sell at a loss. Three sell signals fired while the price sat below the average cost base. All three were blocked. Selling there would have locked in a loss during a dip - exactly the panic move the rules exist to prevent. The signal was real; the guard held. The strategy waited, bought lower, and let the average come down instead.
It won’t sell what it doesn’t hold. Two more sell signals fired into an empty hand - the position had already been worked down to near zero on earlier strength, so there was nothing left to sell. You can see those moments in the holdings view, where ONDO held briefly touches the floor. This isn’t a missed profit. You can’t sell coins you’ve already sold. It is simply the system refusing to invent a trade it has no inventory for.
It won’t buy without cash. The same discipline runs on the buy side. When available cash approaches zero, further buys are blocked rather than funded out of thin air. The strategy can’t go short, can’t over-trade, and can’t spend money that isn’t there.
(A few other sell orders simply didn’t fill at the exchange - ordinary market mechanics, not a decision the strategy made.)
Three guardrails, one principle: only sell above your cost, only sell what you hold, only buy with what you have. Some signals fire into a wall. That is the system working, not failing.
The scoreboard
After three weeks in a falling market, with no intervention from the user:
- Realised profit: about +12% of the starting capital - seven round trips, banked in cash.
- Unrealised: roughly flat - the average cost base ended just below the live price, so the held position wasn’t underwater despite a 20%+ drop in ONDO.
- Net result: positive, in a window where buying once and holding would have left you down.
A quick honesty note: this describes how one rule set behaved over one three-week window. It is not a forecast, and it is not a promise about the next three weeks. Different parameters, a different asset, or a market that falls and keeps falling would write a different story. What this window shows is the mechanism - and the mechanism is the part you can actually count on.
Why a falling price didn’t mean a falling portfolio
Strip it back and there’s nothing clever happening. Buy the dips, which drags your average cost down. Sell the bounces, but only above that cost, which books small gains without ever locking in a loss. Never trade what you don’t have.
It is the kind of patient, unemotional discipline that is simple to write down and almost impossible to do by hand at 2 AM. So you write it down once, and a machine does it - on every 4-hour window, through a bearish month, without needing you to feel anything about it.
Want to try this yourself at no cost? Download Aurono Start and run it in shadow mode. It watches live prices and shows you exactly what it would have done - every buy, every sell, every blocked signal - without touching a cent of real money. When you’re ready, the same strategy goes live with one switch.
→ Download Aurono Start · How shadow mode works · Play with a strategy in your browser