
I aped into ENA. Then I handed my ENA position to Aurono.
Before Aurono had anything to do with it, I bought ENA by hand. No rule, no plan, just the feeling that I didn’t want to miss the move. By the time I got around to pointing an Aurono strategy at the position in April, my average cost was €0.2977 against a price of €0.1022. Down about 66%. The kind of number most people either sell into, to make the feeling stop, or stop looking at entirely.
I did neither. I fed the existing position into Aurono as a starting point, added a bit of fresh capital, set a mechanical rule, and left it alone for four months. This is the honest accounting of what happened, including the part where the strategy lost to doing nothing more clever than a monthly standing order.
What we’re looking at
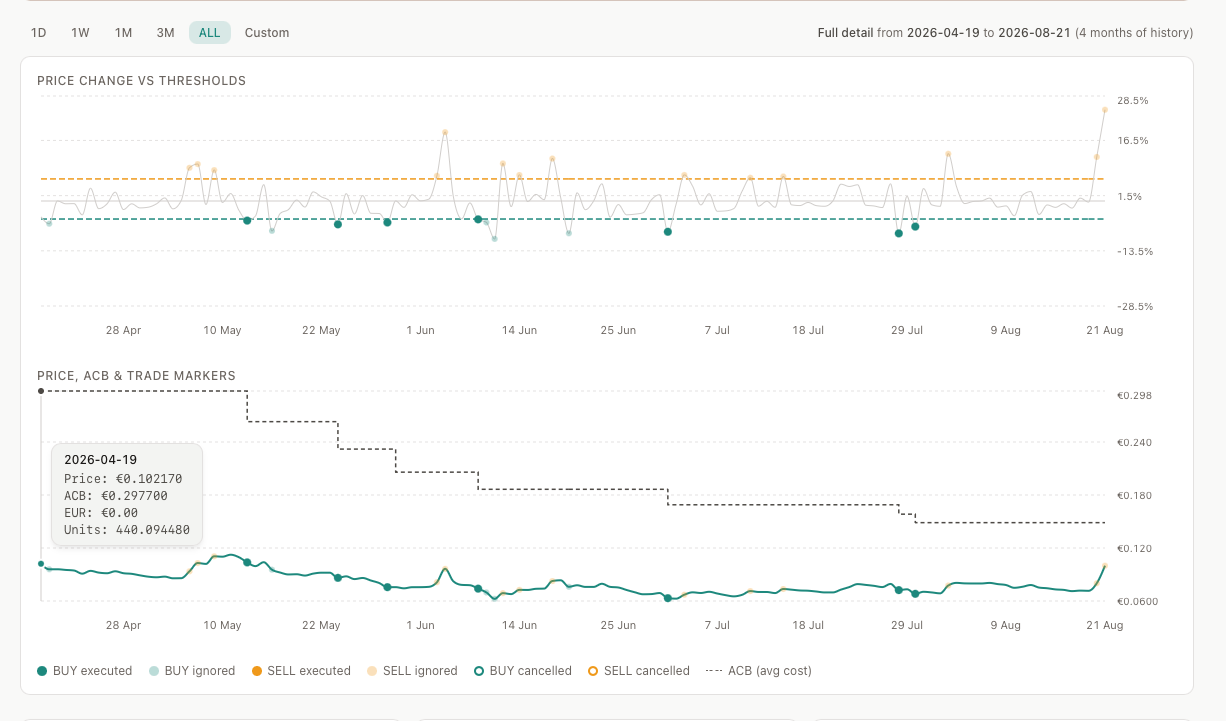
The top chart is the 4-hour price change against two triggers: a buy line and a sell line. The dots are the moments a signal fired, filled in for the ones that executed. The bottom chart is the same period in price terms. The teal line is ENA. The dashed grey line is the ACB, the average cost basis, which started at €0.2977 on day one, the result of my own manual buying.
The setup
One starting position, one rule set, defined once:
- A starting position of 440.09 ENA at an average cost of €0.2977, carried over from the manual buying that came before Aurono.
- A drop trigger that buys roughly €10 of ENA when the daily change falls far enough below normal.
- A rise trigger that sells roughly €10 of ENA when the daily change rises far enough above normal, with the ACB Guard sitting underneath it: never sell below cost.
- A 3-day cooldown between trades on the same side, so the strategy can’t fire twice into the same move.
No price target, no view on where ENA goes next. Just the rule, running against whatever the market did.
What the rule actually did
Over the four months from 19 April to 21 August, the buy line was crossed 12 times. Seven of those became actual buys:
| Date (GMT+2) | Price | Units |
|---|---|---|
| 2026-05-13 | €0.103610 | 96.03 |
| 2026-05-23 | €0.085980 | 114.28 |
| 2026-05-29 | €0.075830 | 130.90 |
| 2026-06-09 | €0.074010 | 135.11 |
| 2026-07-01 | €0.063370 | 152.46 |
| 2026-07-28 | €0.072430 | 132.66 |
| 2026-07-30 | €0.068090 | 143.65 |
The other five buy signals were blocked, not enough cash on hand at the time. Notice the pattern in the table: the price kept falling, and each roughly-€10 buy landed more units than the last, because €10 buys more ENA at €0.06 than it does at €0.10. That’s the entire mechanism behind an average cost that goes down: buy the same amount of money, more often, at lower prices, and the average has no choice but to follow.
The sell line tells the opposite story. It was crossed 14 times. Zero became sales. Every single one was blocked, because the price never once traded above my average cost during those four months. Aurono’s own read on this strategy files it as “Cautious”: it saw the sell signal repeatedly, and it said no, every time, because selling would have locked in a loss I hadn’t yet been forced to take.
The number that actually moved
Here’s the part worth sitting with. On 19 April, the paper loss on this position was about 66%. Today it’s about 33%. Roughly half.
The price didn’t get anywhere near recovering to my original entry. What moved was the average cost basis, from €0.2977 down to €0.148659, one €10 buy at a time, every time the market handed the strategy a real drop. The position is still down. It is down by about half as much as it was, and that’s arithmetic, not luck: every dip bought lowered the bar the price actually needs to clear.
That’s the mechanism doing exactly what it’s built to do: refuse to sell into a loss, and use every dip in the meantime to make the loss smaller. It is not the same thing as being made whole, and I don’t want to claim it is.
The uncomfortable number
Aurono also shows me a Benchmark card on this strategy: -€104.52 vs buy & hold, -€148.46 vs monthly DCA, based on the €210.52 I’ve put in total. Read quickly, that looks like the strategy did worse than doing nothing.
It’s worth being precise about what that comparison actually is. Buy & hold and monthly DCA are both calculated as if the strategy had started from zero ENA, the same €210.52, deployed cleanly from day one. My real position didn’t start from zero. It started already down 66%, from buying I’d done before Aurono was in the picture. Comparing an account carrying that hole to a benchmark that never had one isn’t a fair fight, and I’d rather say so than let a favorable-looking framing slide.
Running the fair fight
So I reran the same rules in the Lab, this time starting clean: €80 in cash, zero ENA, no inherited loss, same four-month window, same triggers.
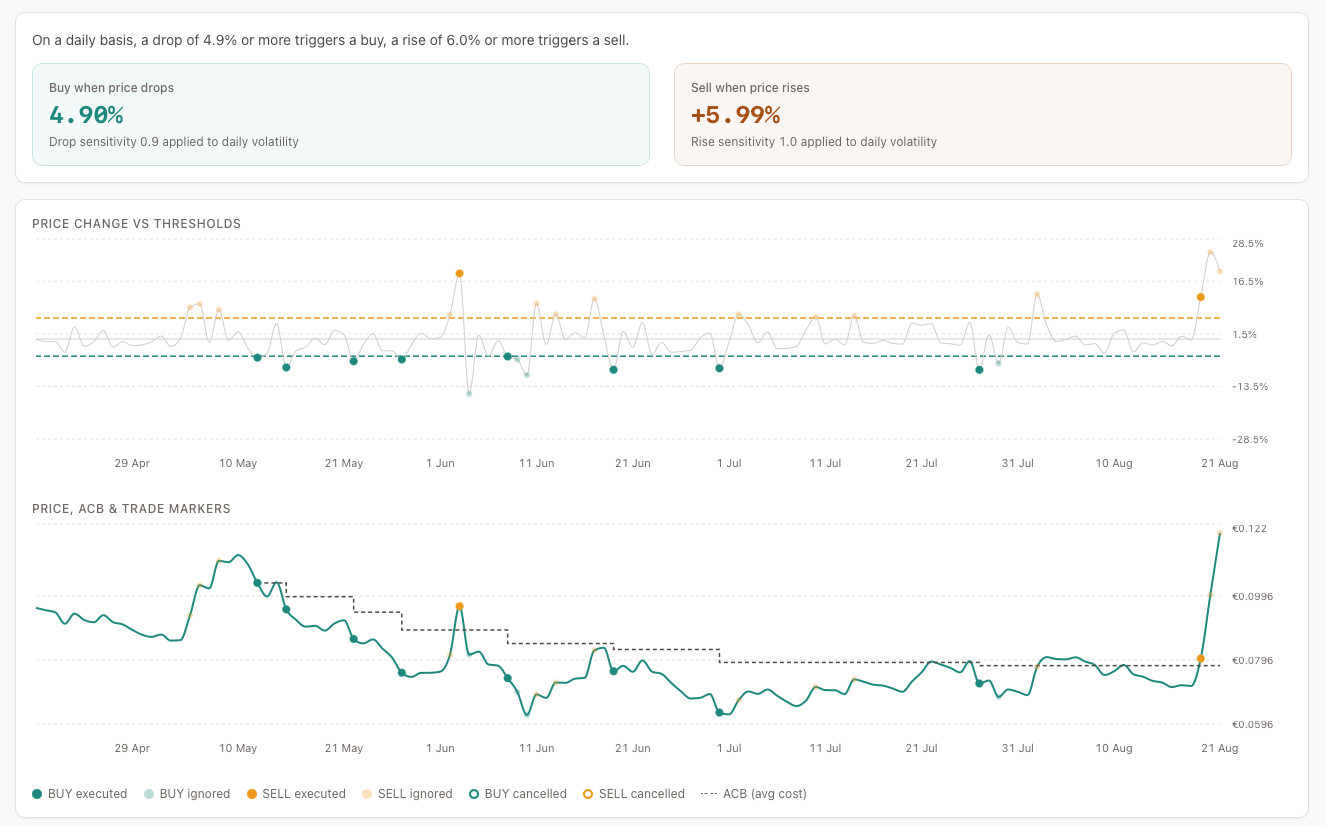
Starting from zero, the same rule set turned €80 into €113.14: +41.4%. Over that same window, a lump-sum buy & hold of €80 would have made +24.0%. A monthly DCA of the same total would have made +56.1%.
So, stripped of the hole I’d already dug myself: the mechanism beat buy & hold. It lost to monthly DCA. Both are true, on this exact asset, over this exact window. The strategy only had €70 of the €80 deployed at its most invested point, waiting for real drops before it would commit more. DCA doesn’t wait for anything, it buys on schedule regardless of price, which meant it caught more of the final week’s spike in full. Threshold-based buying protects you from buying at a bad moment. It can also mean you’re still holding cash on the sidelines when the good moment shows up.
What this does and doesn’t prove
This describes one strategy, on one asset, over one four-month window, with parameters I chose myself. It is not a forecast, and it’s not proof that this approach beats buy & hold or loses to DCA in general, a different asset or a market that kept falling instead of spiking at the end would tell a different story entirely.
What it does show, because the audit trail recorded it as it happened rather than after the fact, is the mechanism itself: a strategy that refused every single sell signal that would have locked in a loss, and used every buy signal it could afford to make that loss smaller, without me watching a chart or making a decision in the moment.
What happens now
Nobody can tell you what ENA does from here, and I’m not going to pretend I can either. The spike at the end of this chart could be the start of something, or it could be the kind of bounce that gives back everything it gained. Down 33% might keep shrinking toward breakeven, or it might sit there for another six months, or it might get worse before it gets better.
I don’t know which of those this is. I’ll leave the strategy running, check the number again in a few months, and write down whatever it actually says, whether that’s a strategy that was right, or a bag that just took longer to lose.
→ See how shadow mode tests a strategy for free · Understanding your average cost basis · Try a strategy yourself in the Lab